


Ready to kick start an OTT streaming platform with us?

 LIMITED OFFER: 1-year free setup for FAST Channels!

English
AWS network cost optimization is not always about reducing the number of resources. In many cases, the bigger opportunity lies in understanding how data moves through the architecture and whether that traffic path is actually necessary.
This was the case for a production video streaming platform running on AWS Cloud. The platform operated continuously, supporting high-throughput and low-latency live streaming workloads with strict requirements for availability and reliability. After the platform went into production, however, AWS network-related costs increased noticeably even though there were no significant changes to the underlying services.
The investigation revealed two unexpected cost drivers. Around 16 TB of data per month was being processed through a NAT Gateway, while approximately 10 TB per month was crossing Availability Zones. These traffic patterns resulted in significant NAT Gateway Data Processing and cross-AZ Data Transfer charges.
Instead of immediately replacing or removing infrastructure, OTTclouds first focused on understanding where the traffic was coming from, where it was going, and why it was taking that path.
Using AWS billing data, VPC Flow Logs, and Amazon Athena, we traced the traffic back to the application’s streaming architecture and identified unnecessary network paths that were generating additional costs.
This case study walks through that investigation, from identifying the unexpected traffic, understanding the underlying architecture, evaluating different optimization approaches, and finally redesigning the traffic path to eliminate unnecessary NAT Gateway and cross-AZ data transfer costs.
More importantly, it highlights a broader lesson in cloud architecture:
A network design can be technically correct and highly available, yet still contain unnecessary traffic paths that increase operational cost.
The key to network cost optimization is not simply using fewer resources. It is understanding how your workload actually moves through the network.
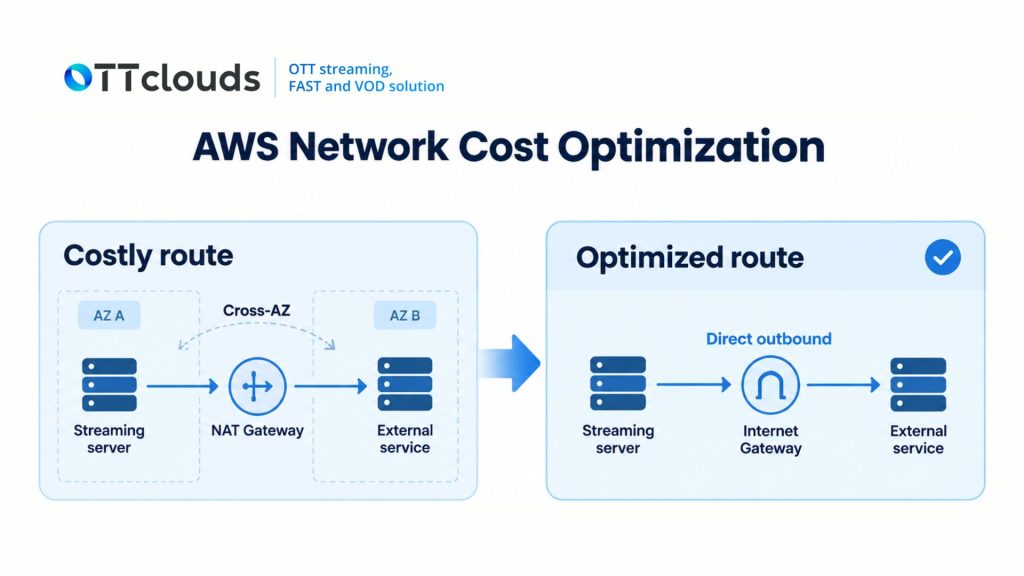
The workload was a video streaming platform for sports deployed on AWS Cloud. It served thousands of concurrent viewers during live events and ran as a continuous production workload with demanding availability and reliability requirements.
At the time covered by the case study, the platform had more than 1,000 active users per day, operated five or more channels in parallel, and handled more than 500 GB of streaming data. Video delivery was continuous, high-throughput, and low-latency, so network traffic was a fundamental part of how the system operated rather than an occasional background activity.
That traffic profile matters when looking at AWS network cost optimization. An architecture can remain technically stable while its cost grows with the amount of data moving through it. Once streaming traffic reaches terabyte scale, the route between a server and its destination can have a meaningful impact on the monthly bill.
The project, therefore, needed to examine cost without losing sight of performance, availability, and security. The goal was not simply to find the cheapest possible network design, but to make the architecture more efficient for the workload it was actually running.
For a related perspective on handling live-event demand, see our guide to designing a live streaming platform for traffic spikes.
AWS Budgets provided the first warning. The service had been configured with cost thresholds so that we could receive alerts when actual spending reached or exceeded the defined limit.
After production was released, the project’s cost began rising. Billing and Cost Management showed that most AWS services had not increased enough to explain the difference, while EC2-Other stood out clearly from the rest. Then, we broke this category down by usage type instead of treating EC2-Other as a single cost bucket.
Two entries became the focus of the investigation:
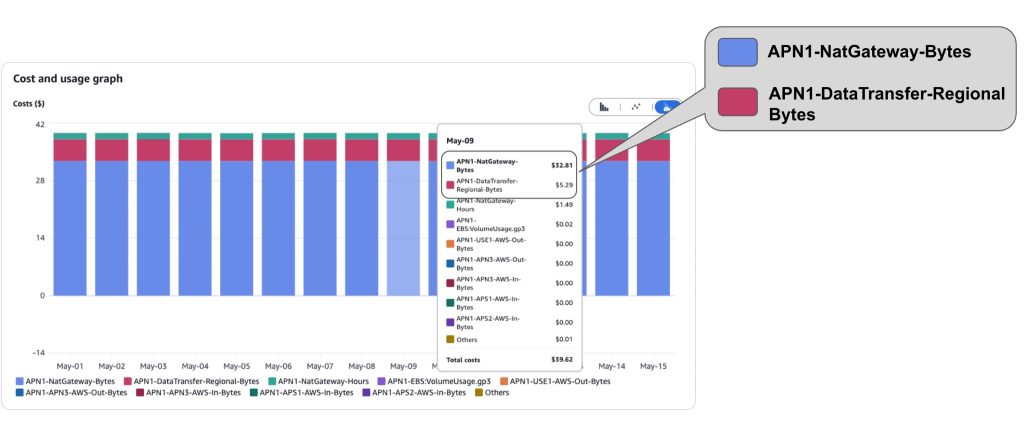
APN1-NatGateway-BytesAPN1-DataTransfer-Regional-BytesThe first represented a large amount of data processed through a NAT Gateway. The second pointed to regional data transfer, specifically traffic crossing Availability Zones.
At that stage, it was clear that the issue was not primarily compute cost. The network path itself needed to be examined.
The NAT Gateway was responsible for the first cost layer. Streaming data was pushed continuously from EC2 streaming servers in private subnets toward public external services for many hours each day, which caused the amount of bandwidth processed through the NAT Gateway to grow significantly.
The cost model behind that path:
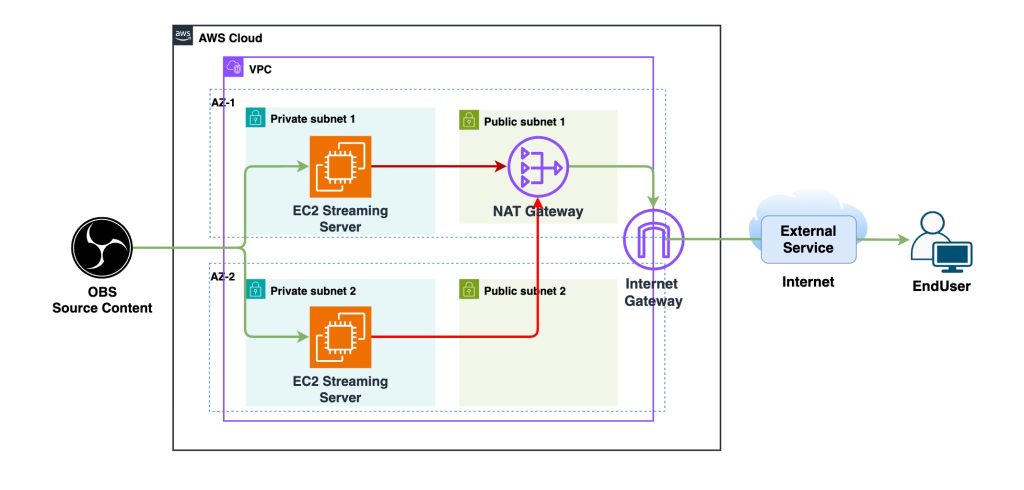
A NAT Gateway included an hourly charge as well as a per-GB data processing charge. The example architecture also included outbound internet egress and Elastic IP cost. With a workload that keeps sending video data, the per-GB component becomes increasingly important as traffic grows.
Cross-AZ traffic created a second layer. Some EC2 streaming servers were placed in an Availability Zone different from the one containing the NAT Gateway. Before their traffic could reach the gateway, it had to cross from one AZ to another, generating DataTransfer-Regional-Bytes.
The resulting path was approximately:
EC2 streaming server → Cross-AZ transfer → NAT Gateway → Internet Gateway → external service
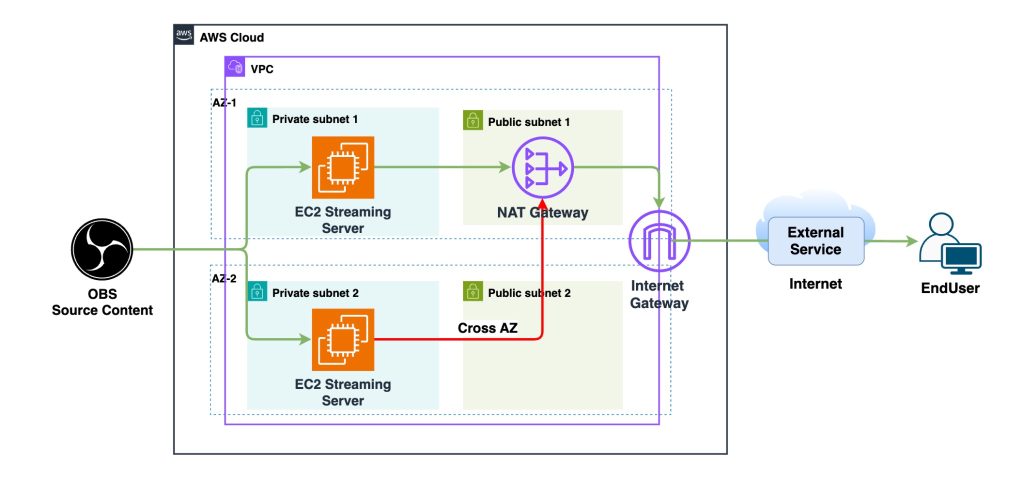
This is what made the cost problem more interesting than a simple “NAT Gateway is expensive” conclusion. The architecture allowed one high-volume streaming flow to pass through multiple billable network steps.
By the time OTTclouds quantified the traffic, NAT Gateway processing had reached approximately 16 TB per month, while cross-AZ transfer accounted for roughly 10 TB per month. The combined monthly cost was around $1.1K, with the expectation that it would continue increasing if user traffic grew.
Knowing which AWS usage types were increasing was only the beginning. OTTclouds still needed to determine which source was creating the largest amount of traffic through the NAT Gateway and across Availability Zones.
VPC Flow Logs provided the traffic-level information needed for that investigation. The logs captured IP traffic moving into and out of ENIs, subnets, or the wider VPC. Fields such as source address, destination address, protocol, action, and transferred bytes made it possible to investigate network behaviour rather than guess from the bill.
We combined those logs with Amazon Athena, which was used to analyze the data stored on Amazon S3 through SQL queries. Instead of manually examining individual flow records, we could query the data to find which private source IPs were sending the largest amount of traffic toward the NAT Gateway.
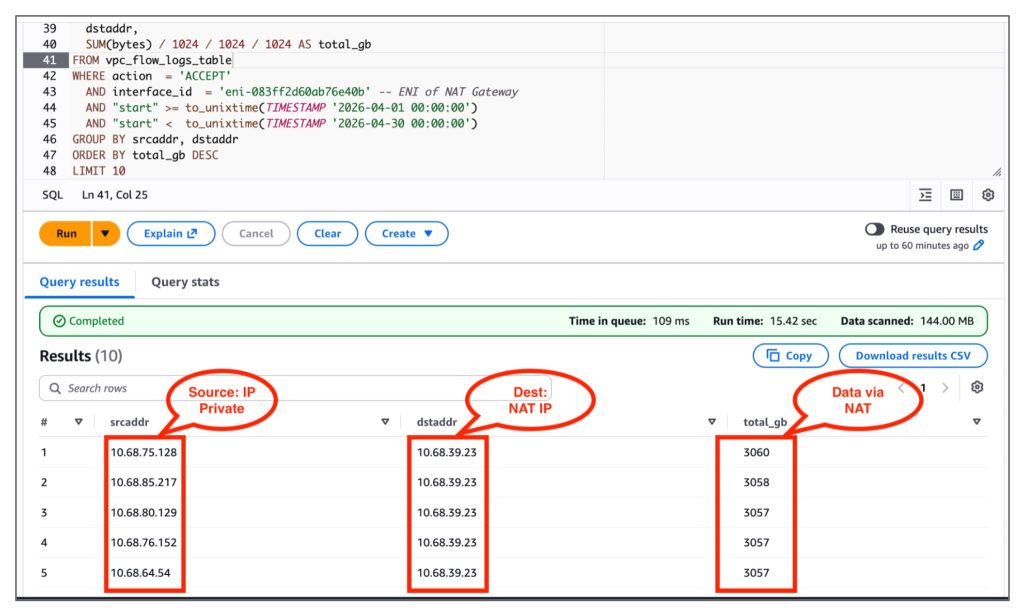
The investigation effectively moved through several layers:
AWS Budget alert → Billing and Cost Management → usage type → VPC Flow Logs → Athena query → source and destination traffic
This workflow connected the cost increase to the actual network path. NAT Gateway processing was high because streaming data was continuously being pushed outside the private subnet, while regional transfer increased because some of those servers were located in a different AZ from the gateway.
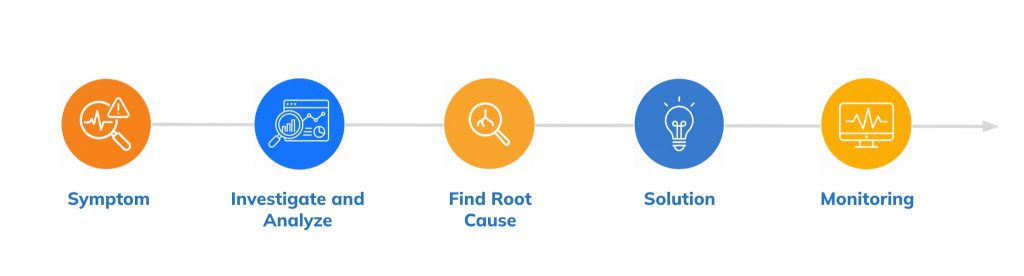
Once that relationship was clear, we could work on the architecture rather than the symptom.
The solution was to place the streaming servers in public subnets with Elastic IPs.
Under the previous design, outbound streaming traffic from EC2 needed to travel through the NAT Gateway before reaching the Internet Gateway. For servers located in another Availability Zone, that route also created a cross-AZ hop on the way to the gateway.
Moving the relevant streaming servers into public subnets changed the route. Their outbound streaming traffic could reach the Internet Gateway directly rather than passing through the NAT Gateway. Because the NAT Gateway was removed from this high-volume path, the associated cross-AZ transfer problem was also addressed.
The difference can be summarized as follows.
Before optimization
EC2 streaming server
→ Cross-AZ transfer in some cases
→ NAT Gateway
→ Internet Gateway
→ External service
After optimization
EC2 streaming server in public subnet with Elastic IP
→ Internet Gateway
→ External service
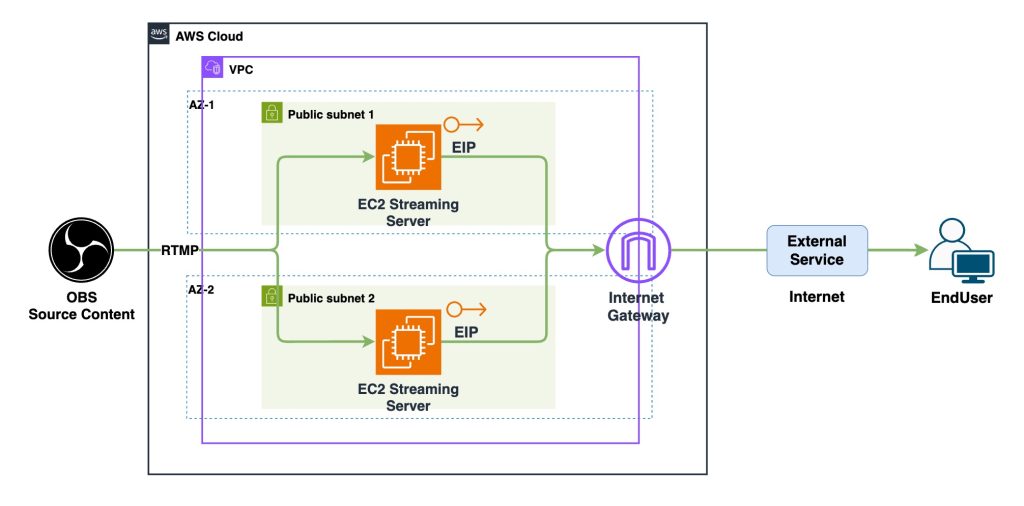
This was a focused architecture change. We did not remove every NAT Gateway or conclude that private subnets were unnecessary. It changed the placement of the servers responsible for the large outbound streaming flow so that those terabytes of traffic no longer needed the previous path.
This change addressed outbound streaming traffic. For a separate look at incoming broadcast feeds, see our private ingest architecture for sports OTT on AWS.
Before the change, approximately 16 TB per month was being processed by the NAT Gateway, and around 10 TB per month was moving across Availability Zones. Together, those two traffic patterns were generating roughly $1.1K in monthly cost.
Monitoring after the optimization showed a very different picture. In the EC2-Other category, only NatGateway-Hours remained, while the large NatGateway-Bytes and regional data-transfer costs that had driven the investigation were no longer present at the previous level. The presentation records savings of more than the previous approximate $1.1K monthly cost.
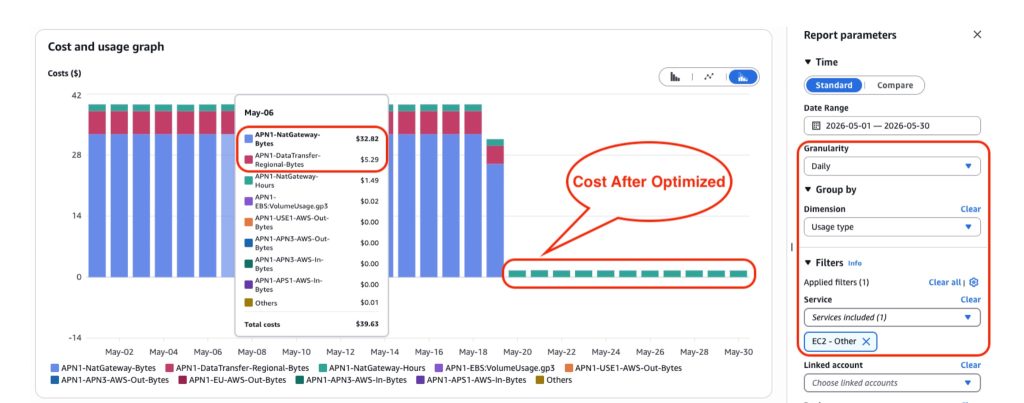
Because the figures in the presentation are rounded, the most accurate way to express the result as a percentage is that the project achieved an approximately 100% reduction in the identified NAT Gateway data processing and cross-AZ transfer costs.
This percentage does not mean that every AWS networking expense disappeared. The NAT Gateway still had its hourly cost. What changed was the expensive variable component created by moving a large volume of streaming data through NAT and across AZ boundaries.
The AWS network cost optimization case started with a billing alert, but the final lesson was about architecture.
AWS Budgets worked as an early warning mechanism. Without that signal, the platform could have continued operating normally while the network bill grew in the background. Once the anomaly was visible, Billing and Cost Management narrowed the problem to particular usage types instead of forcing we to investigate the entire infrastructure.
VPC Flow Logs and Athena then provided another level of evidence. The bill showed where money was being spent, while the traffic data showed what was producing that cost. Using both made it possible to connect NatGateway-Bytes and DataTransfer-Regional-Bytes to specific streaming flows.
Subnet placement was another important part of the result. Where a server runs affects more than connectivity. In this case, it also determined whether a high-volume stream crossed an Availability Zone and whether it needed to pass through a NAT Gateway.
The broader takeaway is the same question raised at the beginning of the presentation. A best-practice architecture is not automatically an optimized architecture because the answer depends on the characteristics of the workload.
For this live streaming platform, high-throughput and continuous traffic changed the cost calculation. Once the network path was evaluated against the way the workload actually behaved, the optimization opportunity became much clearer.
AWS network cost optimization becomes much easier when we can see how data actually moves through the architecture. In this case, billing information identified the symptom, VPC Flow Logs and Athena exposed the traffic behind it, and a change in subnet placement removed an unnecessary high-cost path.
The result was an approximately 100% reduction in the identified NAT Gateway data processing and cross-AZ transfer costs, while the streaming workload continued to operate under its production availability and reliability requirements.
The technical change itself was relatively focused. The important part was finding the right change to make.
Two traffic patterns were responsible. Streaming data was continuously passing through a NAT Gateway, while some EC2 streaming servers were located in a different Availability Zone from the NAT Gateway and therefore generated additional cross-AZ data transfer.
Approximately 10 TB of data per month was transferred across Availability Zones before reaching the NAT Gateway.
We first narrowed the cost increase through AWS Billing and Cost Management, then combined VPC Flow Logs with Amazon Athena to identify the source IPs generating the largest amounts of data through the NAT Gateway and across AZs.
The streaming servers responsible for the outbound traffic were placed in public subnets with Elastic IPs. Their streaming traffic could then reach the Internet Gateway without travelling through the NAT Gateway, while the associated cross-AZ transfer path was also removed.
No. Monitoring after the change showed that NatGateway-Hours remained. The optimization targeted the large variable costs associated with NAT Gateway data processing and cross-AZ transfer.


 Link copied!


